Step by step SWAT-CUP for Calibration
Step by step SWAT-CUP for Calibration
The detailed information can be find out from
1- https://www.mssanz.org.au/MODSIM07/papers/24_s17/SWAT-CUP_s17_Abbaspour_.pdf,
2- http://www.neprashtechnology.ca/Default.aspx)
Requirements:
1- ArcGIS/QGIS, Arc SWAT/QSWAT, SWAT CUP and good processing speed of computer
2- TxtInOut scenario of swat project run, observed data-sets like discharge (cms), sediment yield (t/ha) etc.
Step by Step procedures
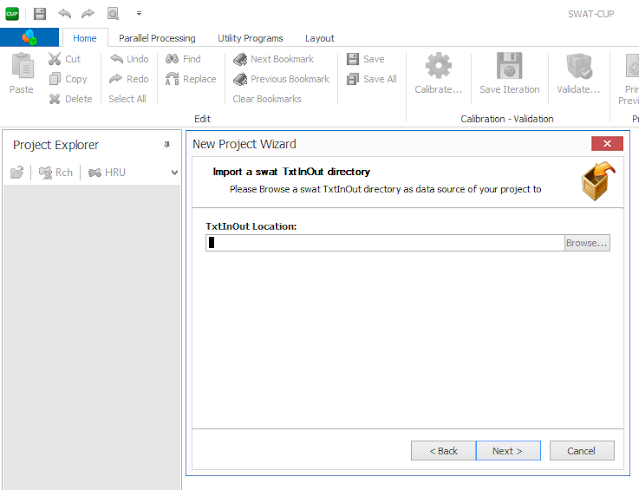
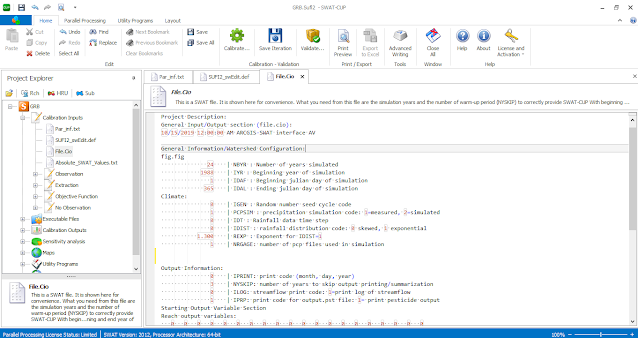
1-Interface of swat-cup
2-Setup
the swat-cup project
3: Data input and their formatting
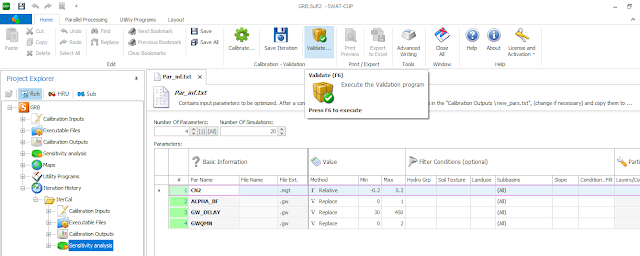
Par_inf.txt provide the facility to select the parameters and their subsequent ranges.
Here three methods are available for parameters as
r: existing parameter value will be replaced by the given value
v: value will be added to the existing parameter values
a: existing parameter is multiplied by (1 + given value)
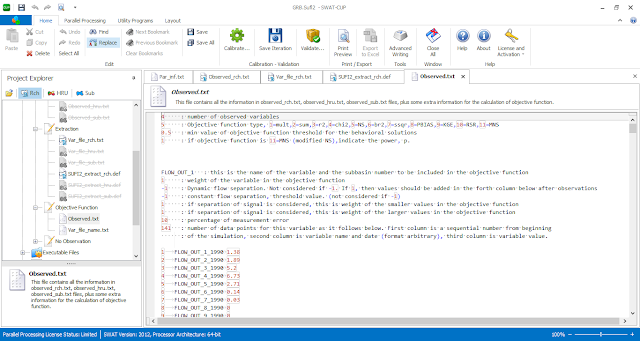
Generally it was recommended that users should use all types of method during parameters selectionObserved _rch.txt: Number of observed variables explains the total outlet observed data taken during the calibration.
Flow_out_1 explains the discharge flow at outlet 1
And 141 is the total data series form beginning year simulation to end year of simulation excluding the warm-up period of model.
The format of observed data input are as follows:
Data point_ observed variable_outlet no_begining year observed valueSUFI2_extract_rch.def: important portion where total variables, variables column number in swat
output.rch, total reaches in the basin and sub basin reach number, Swat-cup running time step are
provided.
Like the Observed_rch.txt, here we have to provide the information’s of total observed variables,
objective function and their threshold value. Here we have to input the all observed variable at
selected outlets.
Model running … like simulation 1 it will complete all simulation you have selected in par_inf.txt and SUFI2_swEdit.def
After the model will complete the run save it as Iter cal.95ppu: It show the 95ppu of all variables and also the observed and simulated data relation for all data input point.
Here we have taken the 4 observed variables therefore 95ppu can be seen for all 4 variables with observed and model sim.How to make 95 ppu plot using Excel
Dotty plot shows the parameter value versus objective function.
The main aim of this plot is to show distribution of sampling point for each simulation and to provide the idea of parameter sensitivity.Summary show the statistical performance of model during the calibration period.
Here we can find the
p-factor: the percentage of observed data captured by the 95ppu
r-factor: width of 95ppu
R2:Coff. Of determination
NSE: objective functionPBIAS: percentage of biasness
Sensitivity analysis to check the sensitivity of input parameters during the calibration.
Sensitivity analysis at Grid View using the t-stat and the p-value
After the
calibration results the performance of model can be evaluated using the Moriasi
et al.(2007) and Moriasi et al(2015) criteria of model performance evaluation. After the
successful model calibration further model can be validated in the same way using
the calibrated parameters.


Fell free to discuss your problem related to SWAT-CUP
ReplyDeleteManually I calibrate my SWAT model and water balance ok. but I calibrated by SWAT-CUP, the value of NS is big negative value and R2 is also very low . Do u have any idea about these values?
DeleteDue to range of parameters. You have to see what is the value of calibrating parameters in your study area.
DeleteDon't worry I will help you.
I calibrated by SWAT-CUP , My NS is big negative value and R2 is also very low .I tried to adjust the parameters several times and the effect was not good, how can i do
DeleteI got error 72 overflow .
ReplyDeleteD:\Scup_29a\Scup_29a.Sufi2.SwatCup>SUFI2_goal_fn.exe
Could Not Find D:\Scup_29a\Scup_29a.Sufi2.SwatCup\SUFI2.OUT\beh_.
!ERROR simulation number 1 in variable file 1 is missing or has a problem
D:\Scup_29a\Scup_29a.Sufi2.SwatCup>SUFI2_new_pars.exe
Reading goal file
forming Jacobian
calculating delta pars
reading best parameters
Cannot open input file .. SUFI2.OUT/best_par.txt
D:\Scup_29a\Scup_29a.Sufi2.SwatCup>SUFI2_95ppu.exe
finished reading observation file
reading FLOW_OUT_8
Error! simulation 0 has problems
D:\Scup_29a\Scup_29a.Sufi2.SwatCup>SUFI2_95ppu_beh.exe
Cannot open input file /SUFI2.OUT/no_beh_sims.txt
THIS IS NOT AN ERROR!!
There were no solutions with the
objective function value >= the behavioral threshold
D:\Scup_29a\Scup_29a.Sufi2.SwatCup>rem 95ppu_NO_Obs.exe
WHAT IF I AM GETTING CONSTANT DOTTY PLOTS, Even if I am running 500 simulations for 5 parameters . All parameters are sghowing constant values.
ReplyDeleteExpand your parameter ranges.
DeleteI also got error 72 overflow .
ReplyDeleteD:\Scup_29a\Scup_29a.Sufi2.SwatCup>SUFI2_goal_fn.exe
Could Not Find D:\Scup_29a\Scup_29a.Sufi2.SwatCup\SUFI2.OUT\beh_.
!ERROR simulation number 1 in variable file 1 is missing or has a problem
D:\Scup_29a\Scup_29a.Sufi2.SwatCup>SUFI2_new_pars.exe
Reading goal file
forming Jacobian
calculating delta pars
reading best parameters
Cannot open input file .. SUFI2.OUT/best_par.txt
D:\Scup_29a\Scup_29a.Sufi2.SwatCup>SUFI2_95ppu.exe
finished reading observation file
reading FLOW_OUT_8
Error! simulation 0 has problems
D:\Scup_29a\Scup_29a.Sufi2.SwatCup>SUFI2_95ppu_beh.exe
Cannot open input file /SUFI2.OUT/no_beh_sims.txt
THIS IS NOT AN ERROR!!
There were no solutions with the
objective function value >= the behavioral threshold
D:\Scup_29a\Scup_29a.Sufi2.SwatCup>rem 95ppu_NO_Obs.exe
How to sort out this error??
Please help me!!